Visualising Front-End Performance Bottlenecks
Introduction
Performance is a core part of the user experience on the web. When performance is poor, users don’t convert as often.
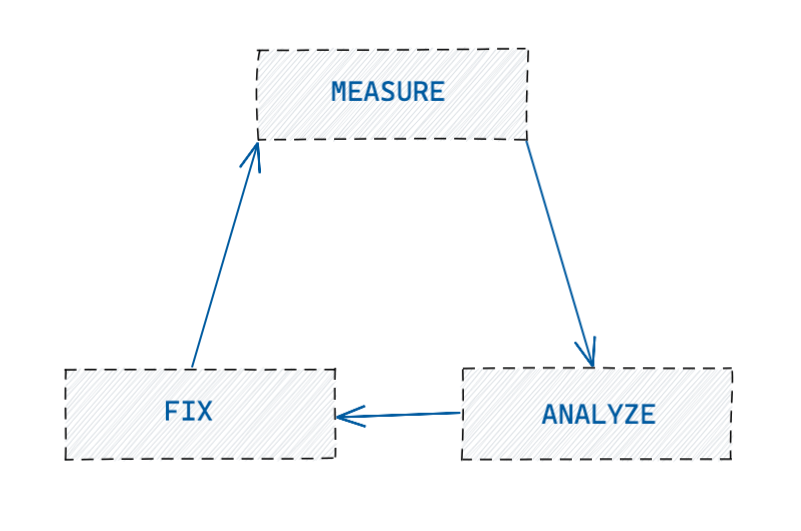
There are many ways to quantify web performance but the principle remains the same. First you measure to get a baseline, then analyze the results and then attempt to fix it. This cycle can repeat until you have a new baseline that you are happy with.
The most important thing is to measure what actually matters to users. I am going to show you how to analyze and improve slow running JavaScript code. We’ll do this with the help of Chrome Developer Tools.
I’ll be covering browser APIs that let us mark and measure our code. We will use a small demo application that we can analyze and improve as we go.
Prerequisites
If you would like to follow along with the demo, please read through the following. Otherwise, feel free to skip this section!
You will need the following installed:
- git
- npm
- a code editor of your choice
It will also be helpful to have an understanding of JavaScript, React and a basic familiarity with Chrome DevTools
Setting up the Demo
git clone https://github.com/richiemccoll/visualising-front-end-performance-demo.git
git checkout before-fixes
npm i
npm start
This should open a new browser window for you that should look something like:

User Timings API
The first thing we need to cover is how to measure slow running code.
Browsers provide an interface on the window called window.performance. We can use this to retrieve performance information about the current page. For the purposes of this demo, we will focus on two methods.
window.performance.mark()
Implied by the name, this API will let us insert start and end marks in slow running functions. A mark is just a timestamp with an associated name.
We can use it like so:
function createUser() {
    window.performance.mark('createUser-start');
    // ...
    // Ensure that any return statement is after this end mark.
    window.performance.mark('createUser-end');
    return user;
}
window.performance.measure()
This API will let us create a measure between two marks (start and end). A measure is also a timestamp with an associated name.
Creating this measure is what will help us visualise functions in Developer Tools. If you forget to add this, you won’t see anything 👀.
We can use it like so:
function createUser() {
    window.performance.mark('createUser-start');
    // ...
    // Ensure that any return statement is after this end mark.
    window.performance.mark('createUser-end');
    window.performance.measure(
        'createUser-measure',
        'createUser-start',
        'createUser-end'
    );
    return user;
}
That is all we need to cover from window.performance for now but I recommend checking out the full API on MDN
Analysing the UI
We are going to be running this demo in development mode. Generally speaking, it’s better to run measurements on a production build. The reason for this is that libraries tend to strip out code that isn’t required for production. For example, developer warnings. This can affect measurements so it’s worth keeping in mind.
The feature we will analyze is changing the order (oldest-newest) of SpaceX launches. If you have the demo up and running, try clicking the button to change the order. Now open Chrome DevTools and switch over to the Performance tab.
This screen can look a little daunting if you are not familiar with it. This is a great link for understanding how to use it.
Let’s change the CPU throttling option to 6x slowdown and then try clicking that button a few times.
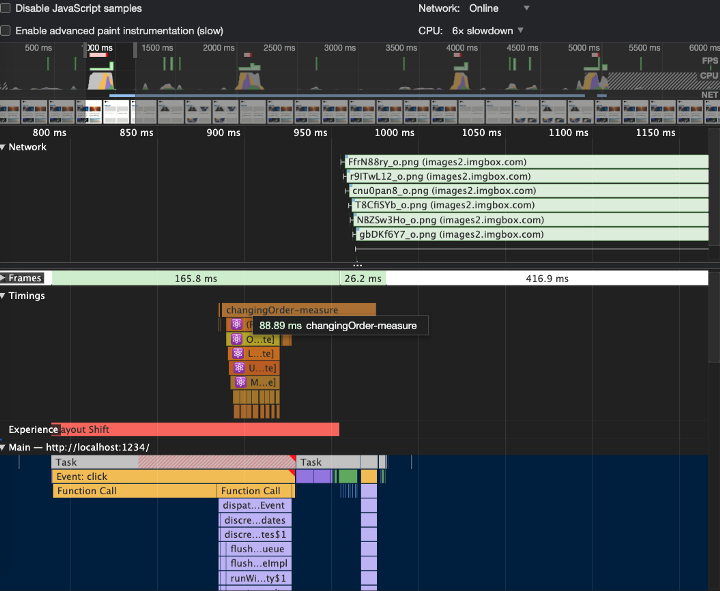
Do you notice anything different? It feels a bit sluggish. If we hit record while clicking this button, we can see what work the browser is actually doing.
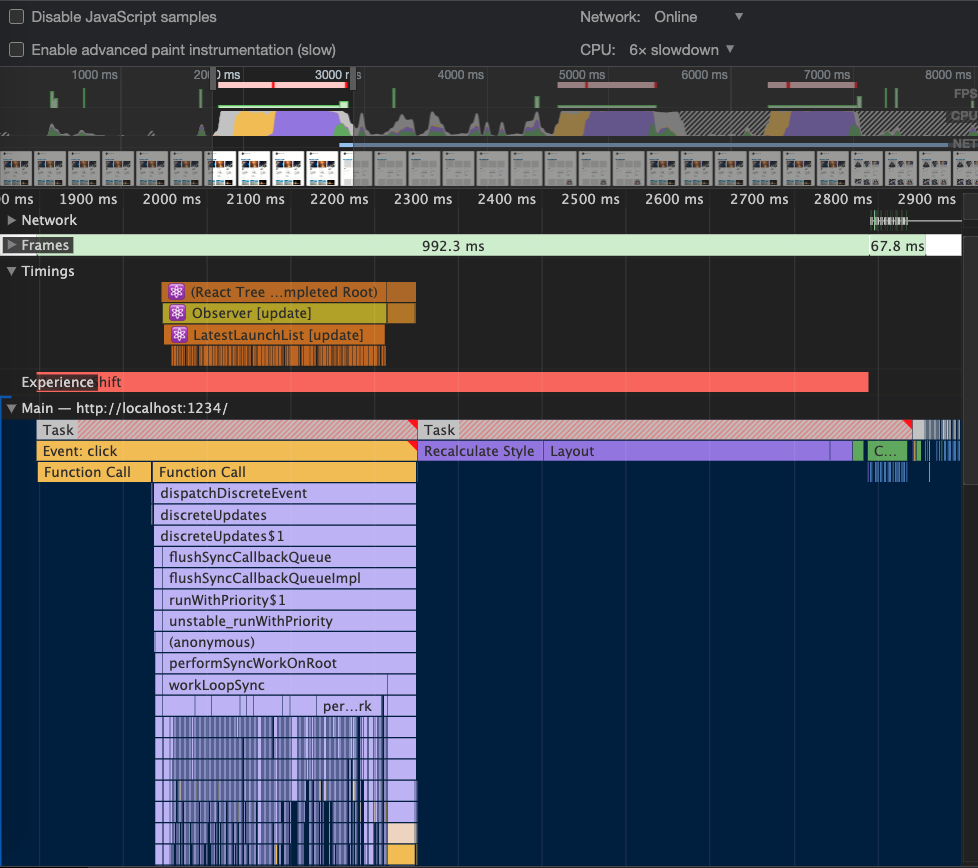
There is a lot going on here. After we click the button, there is a big spike in JavaScript activity on the main thread (the yellow block). After the JavaScript finishes, Style and Layout (the dark purple blocks) run. The browser then paints the update to the screen (the small green blocks)
We also see a nice real world example of performance measures. The User Timings from React. These are only available in development mode and it isn’t recommended to rely on these being there. The React Profiler is the way to go for measuring React performance, I’ll be covering this in a future post.
Getting a baseline
The first thing we want to do is get a baseline measurement by marking start and end points. Let’s create the start mark in the onClick event handler for the button.
Open src/components/LatestLaunches.js and add it before calling setOrder.
<button
  onClick={() => {
    performance.mark("changingOrder-start");
    setOrder();
  }}
  className="bg-blue-500 hover:bg-blue-700 text-white font-bold py-2 px-4 rounded"
>
  Click to view {order} launches
</button>
With that in place we now want to mark the end and create a measure. The first thing we have to know is when the ordering has changed. One way to do this would be to compare the order prop value from the previous render with the current render order value. If it is different, mark the end.
We can store the value from the previous render in a ref, with a custom hook called usePrevious.
function usePrevious(value) {
  const ref = useRef();
  useEffect(() => {
    ref.current = value;
  });
  return ref.current;
}
To use this custom hook, we will need to create a new effect which will run after the LatestLaunches component has rendered. This means we will see how much work the browser does in total.
function LatestLaunchList({ launches, setOrder, order = "older" }) {
  const prevOrder = usePrevious(order);
  useEffect(() => {
    if (prevOrder && prevOrder !== order) {
        performance.mark("changingOrder-end");
        performance.measure(
          "changingOrder-measure",
          "changingOrder-start",
          "changingOrder-end"
        );
      }
    }
  }, [order, prevOrder]);
  return (
    ...
Now switch back over to Chrome DevTools, hit record and start clicking that button again!
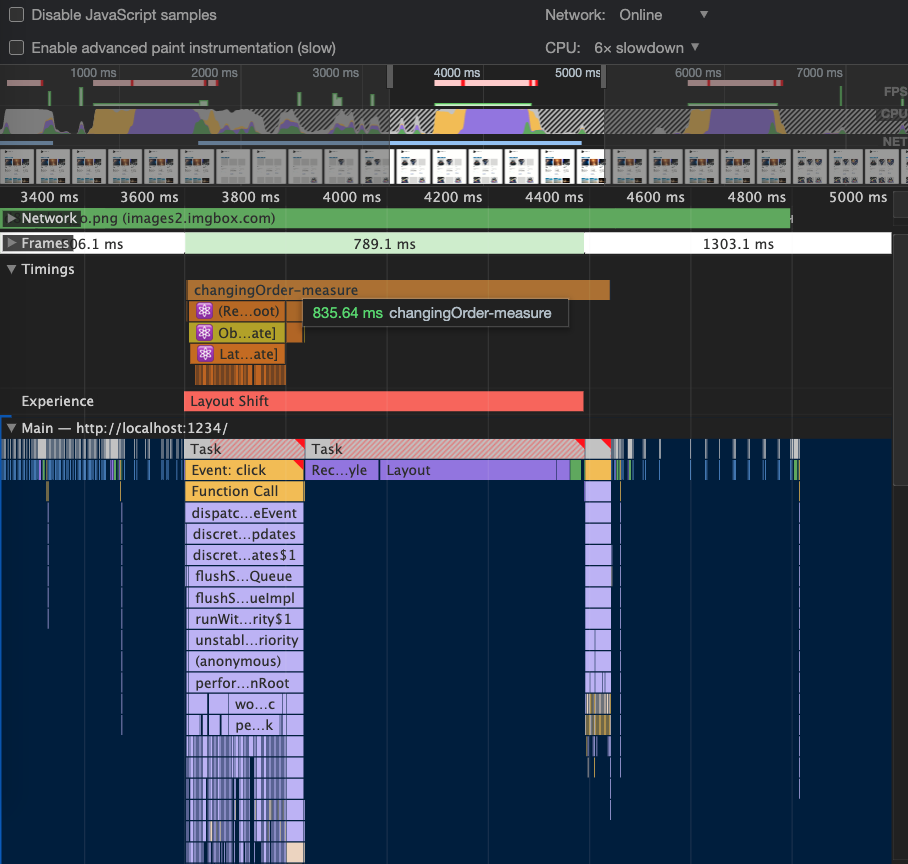
The changingOrder-measure is our first baseline. This is the number that we will be trying to improve. On my machine I’m seeing around 800ms.
Remember: We introduced some minimal instrumentation work to get the measurements (the usePrevious custom hook) so we exclude the duration of that from the measure.
Fix # 1 and measure
Let’s tackle the low hanging fruit first. We can prevent React from re-rendering the Card component too many times. There is an out of the box utility provided by React called memo that we can use.
So let’s open src/components/Card.js, and import that.
import React, { memo } from "react";We can then use it by passing in the component that we want to memoize.
export default memo(Card);Now let’s switch back to DevTools, take another recording and see how these changes affect our baseline.
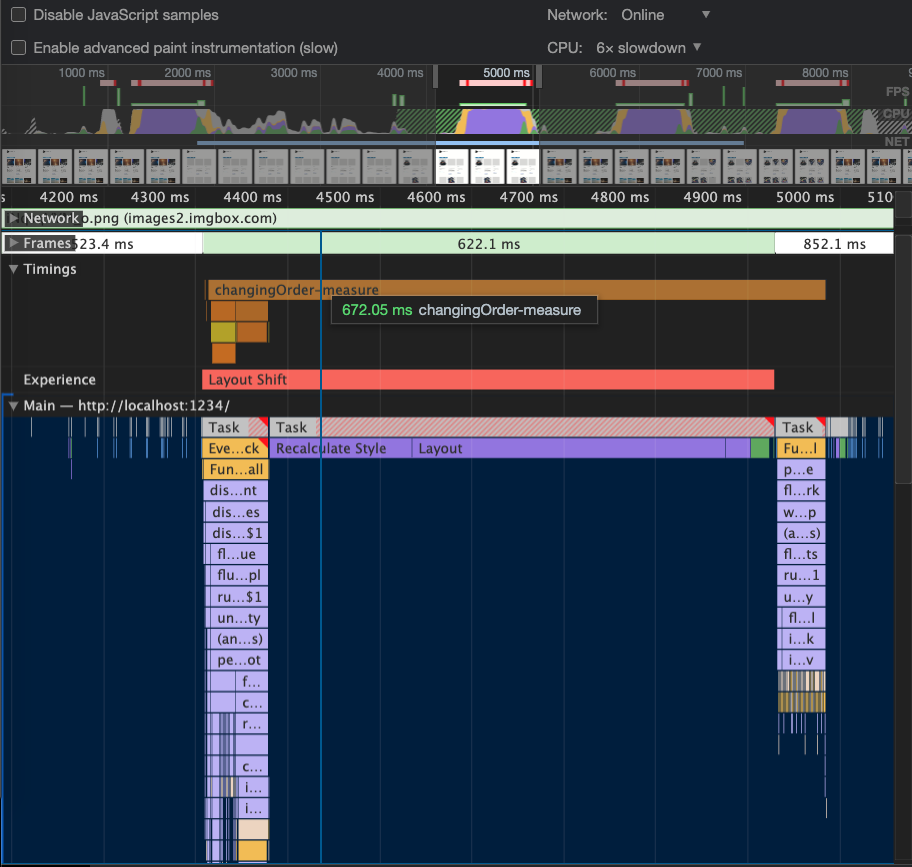
The new baseline is between 600-700ms. This still isn’t great. So what other fixes can we do?
Let’s think about what’s actually happening step by step when we click the button to change the order.
1. We tell the Launch store to update it’s internal ordering state.
2. React then receives this new value as props. React runs through the reconciliation algorithm to update the order of cards.
3. The browser then has to run Style to recalculate the styles that have changed for each card.
4. As the cards have changed, the browser runs Layout to calculate the sizes and positions for each one.
5. The browser will then paint the ordering update to the screen.
The one common factor across each of these steps is the number of cards. This is where we should focus the next batch of performance fixes.
Let’s see how many Card elements we are dealing with here.
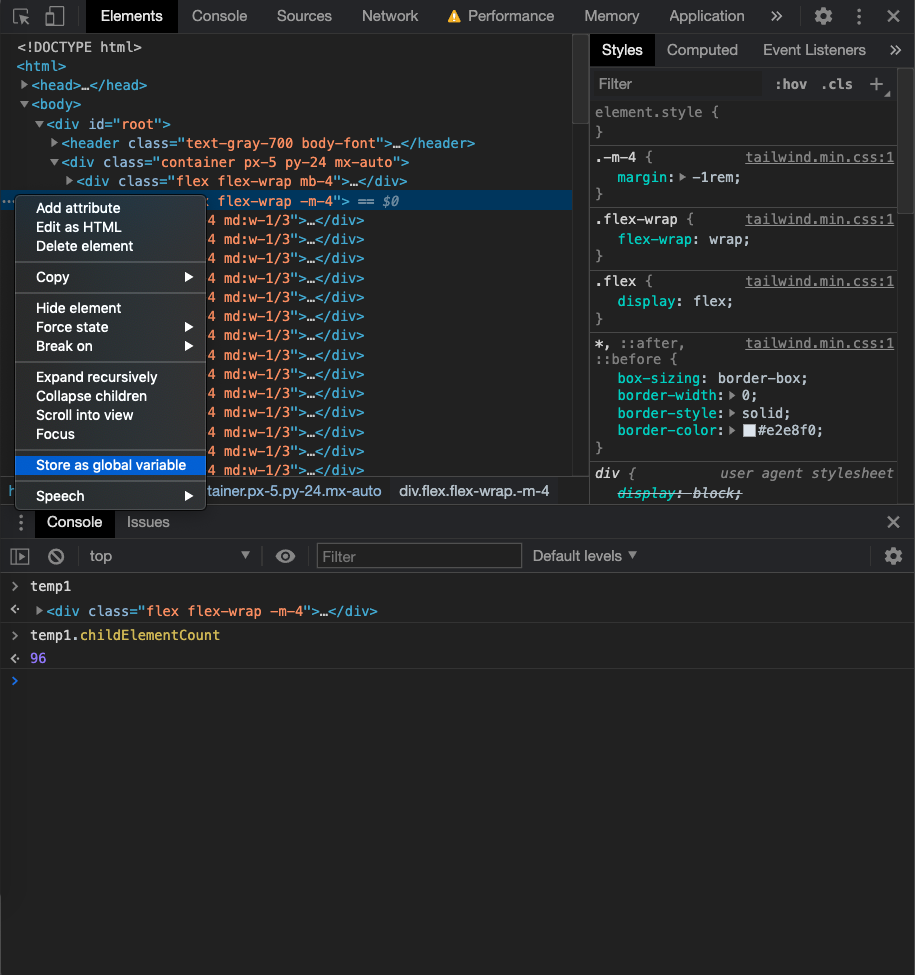
TIP: A quick way to do this is to open the Elements tab in DevTools. Right click the div element that contains the cards and store it as a global variable. Accessing the childElementCount property tells us that there are 96 cards in the DOM.
From a UI perspective there are around 5–10 Cards visible at any given time. This also means we don’t need to have 96 of them in the DOM.
Virtualisation
There is a common rendering technique designed to mitigate this problem. This concept is known as “List Virtualisation” or “windowing”. Essentially the number of DOM elements rendered at any given time is only a small part of the list. The “window” then moves when the user scrolls, updating the content on screen as they go.
There are several libraries that provide this technique out of the box. Some examples include:
I decided to opt for masonic in this demo as there is minimal custom implementation required to get started.
Let’s import it in src/components/LatestLaunches.js.
import { Masonry } from "masonic";Let’s change the way that we render the list of cards.
 <div className="flex flex-wrap -m-4">
    <Masonry
      items={launches}
      render={({ data: launch }) => {
      return (
          <Card
            name={launch.name}
            details={launch.details}
            image={launch.imgUrl}
            url={launch.url}
            date={launch.date}
          />
          );
        }}
      columnWidth={300}
    />
</div>
Time for some more recording and button clicking. Let’s switch back over to Chrome DevTools.
Nice 🔥. Things are starting to look a bit better now that we’re reducing the amount of DOM elements. The baseline is now around 80-150ms. Using Virtualisation has managed to cut half a second of work.
Conclusion
There are certainly more optimizations that we could do get this baseline number even smaller, however I’ll leave that as an exercise for the reader.
The key takeaway is understanding the measure, analyze and fix cycle. For front end performance issues we can use the User Timings API to do this.
Have a read through the following links as well if you want to dive deeper into performance.
If you have any questions or comments, please get in touch.
Attributions
- https://developer.mozilla.org/en-US/docs/Web/API/Performance
- https://developers.google.com/web/tools/chrome-devtools/evaluate-performance/reference
- https://github.com/facebook/react/pull/18417
- https://web.dev/virtualize-long-lists-react-window/
- https://reactjs.org/blog/2018/09/10/introducing-the-react-profiler.html